Research & Analysis Menu

Indiana - Comparative Trends Analysis of Population, 1969-2022
Indiana

Introduction & Summary

Generate graphic analysis and summary reports of local area growth and change. Compare trends focusing on population. Attracting and retaining people to live, work, raise a family, and retire underlies the economic growth of any region. Population growth is both a cause--and a consequence--of economic growth. Patterns of population growth and change reflect differences among regions to attract and retain people both as producers and consumers in their economy.

Directions

  1. Click to view one or more of the regional classifications listed below or from the "Region Selection Menu" to the right. You may need to scroll down to view the entire selection menu.
  2. Using the "Region Selection Menu" on the right, select two regions of interest with the first selection being the primary focus to be compared with the region designated as your second selection.

Additional Suggested Analysis

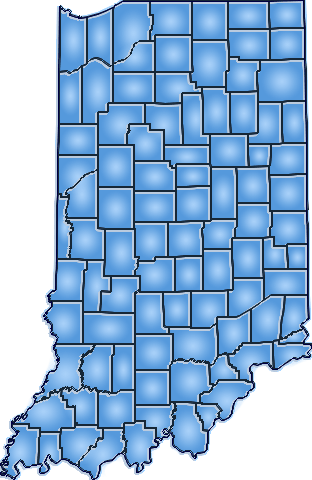
To compare and examine population across all 92 Indiana counties, enlist the interactive mapping and ranking features at your disposal by clicking on the map below.

Population Growth by County

Average Annual Percent Change, 1970-2022

Population Growth by County
Brought To You By:
Copyright © 2024. Pacific Northwest Regional Economic Analysis Project (PNREAP). All Rights Reserved.

Please stay tuned...
while your request is processing:

Please wait while your request is being processed...
To offer the most comprehensive set of interactive options in support of your research, IN-REAP calculates and crunches most of the data and generates the narrative and graphic analysis on demand in response to your request.
Your request will soon be available.
Just a few more seconds....Your request has been generated and is now loading the results.